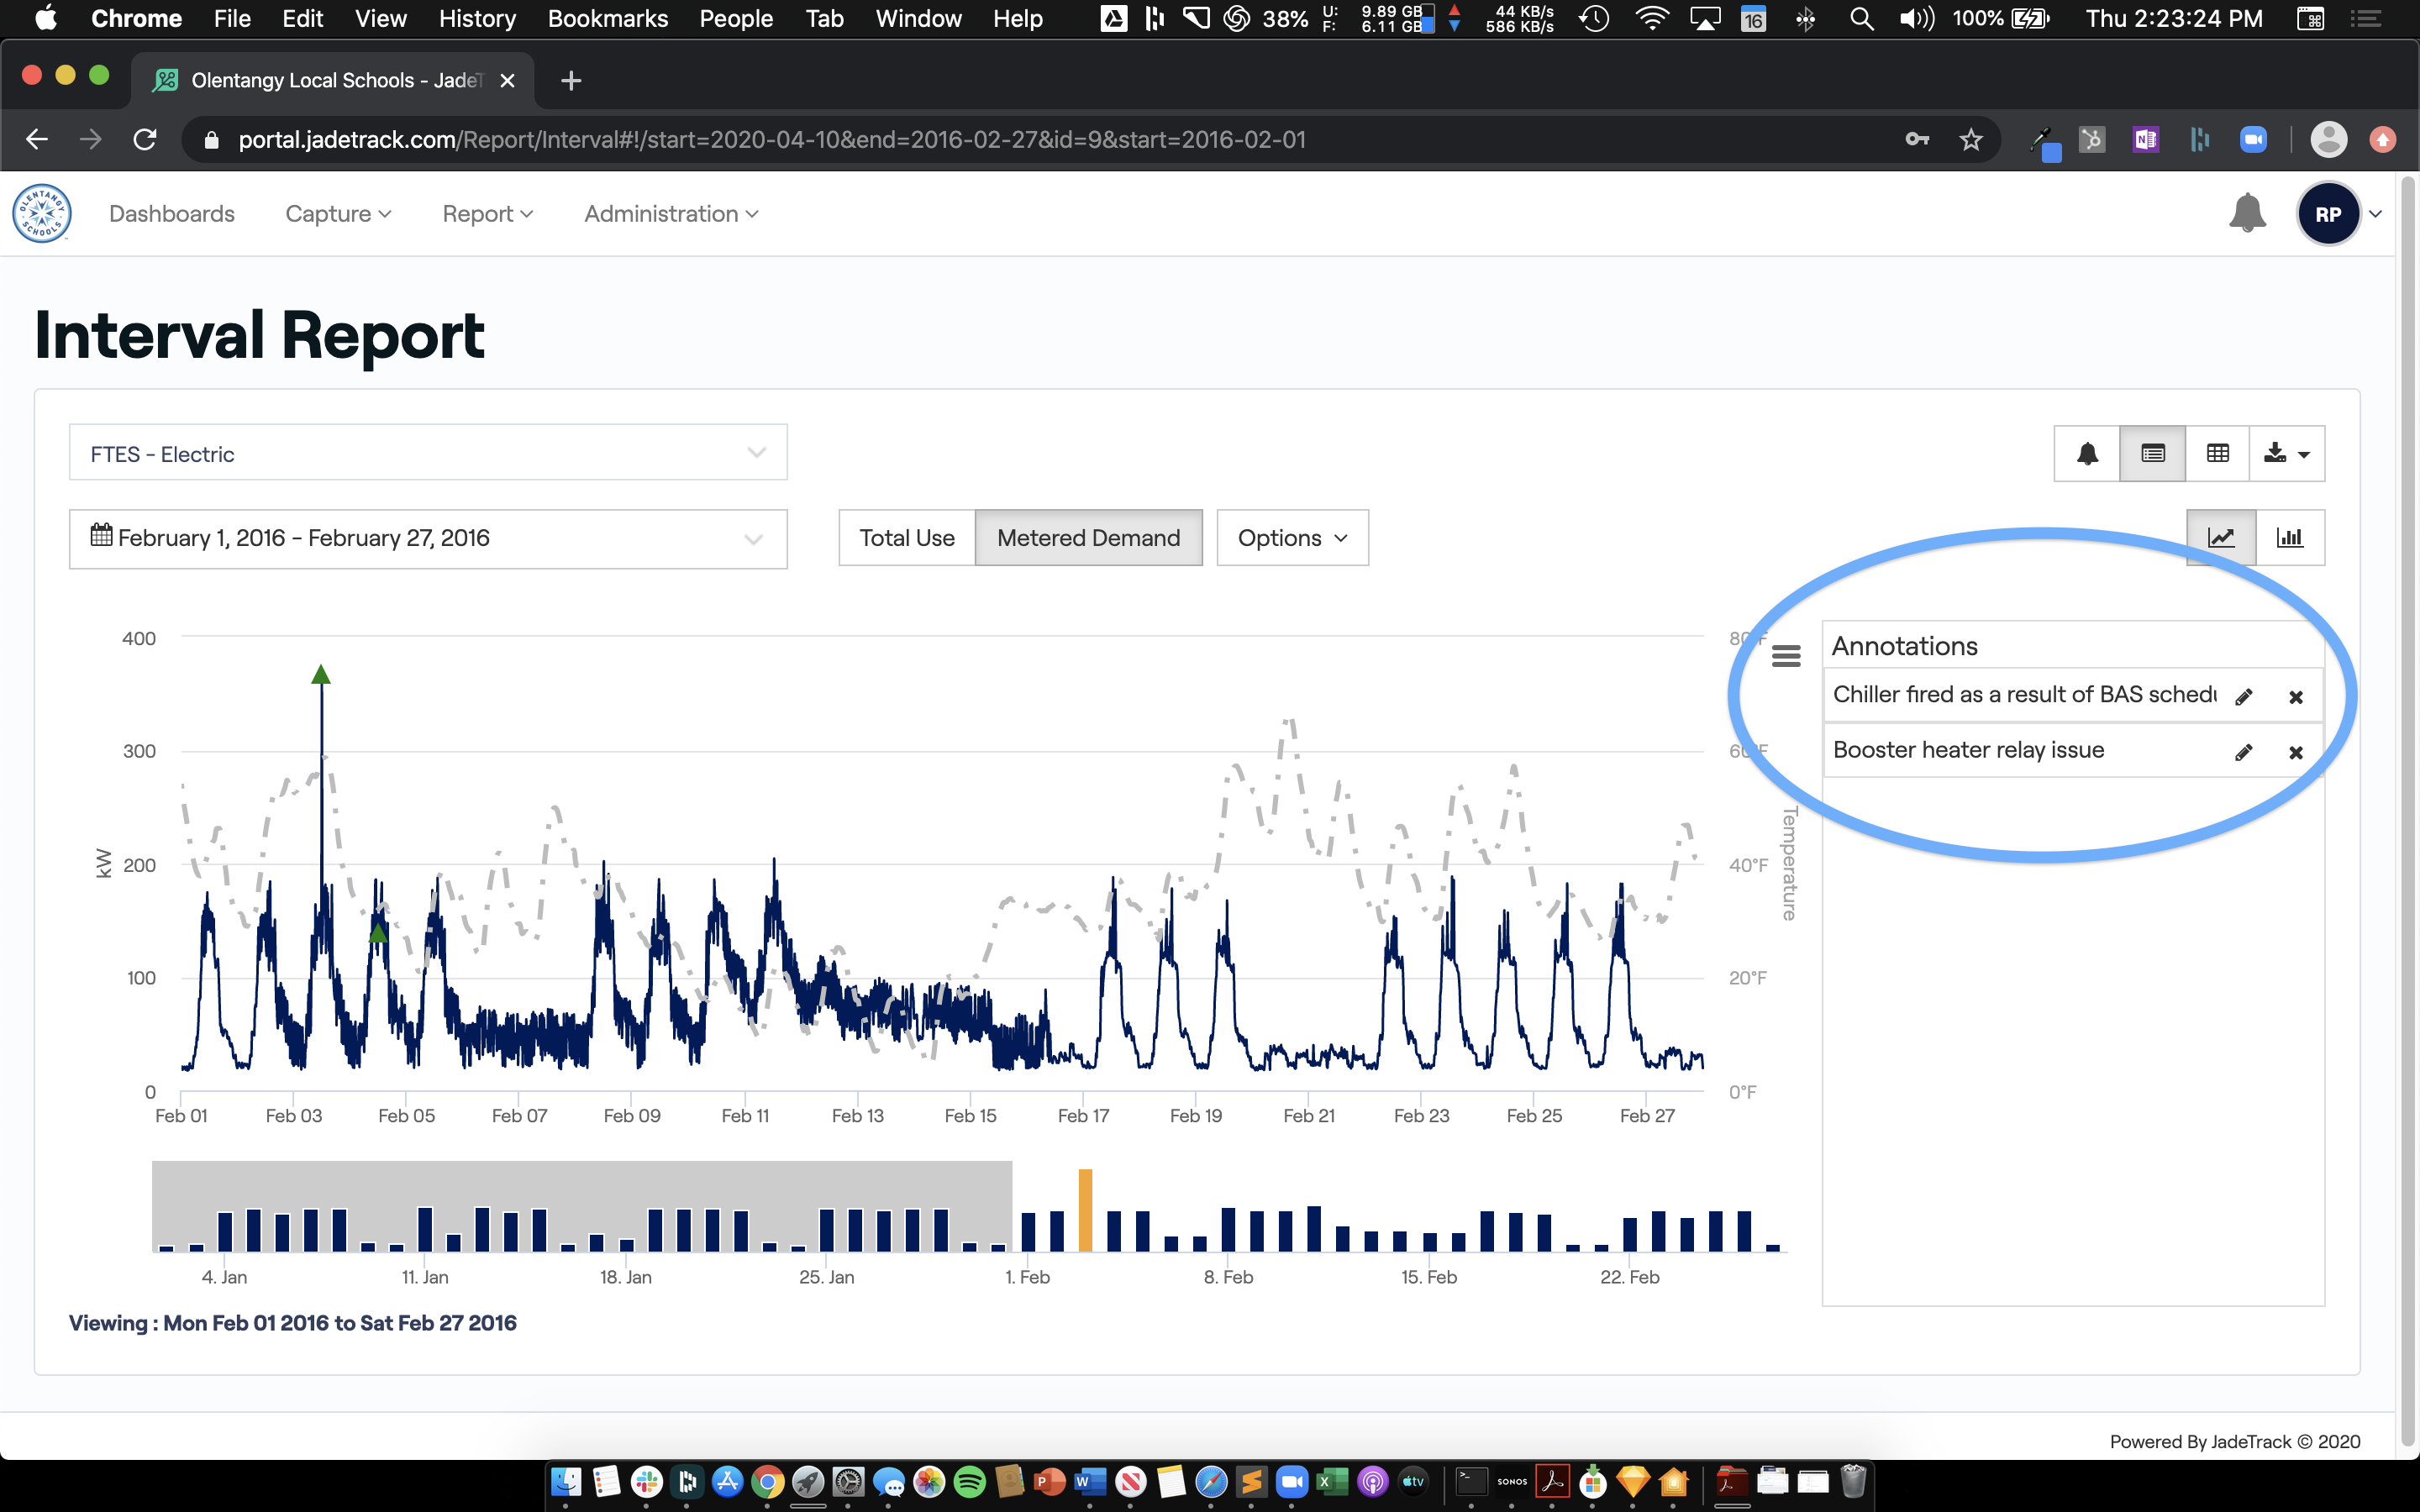
Annotations are a great way to capture context about what is happening in the real-time data. With annotations you can mark data points for things that may happen (i.e. a devious dishwasher, a BAS system override, etc.).
Instructions
Step-by-step guide:
From the interval report, select a meter and a date range to run the report
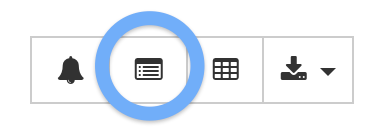
Click the annotations button to expand the annotations box to display a current list of annoations

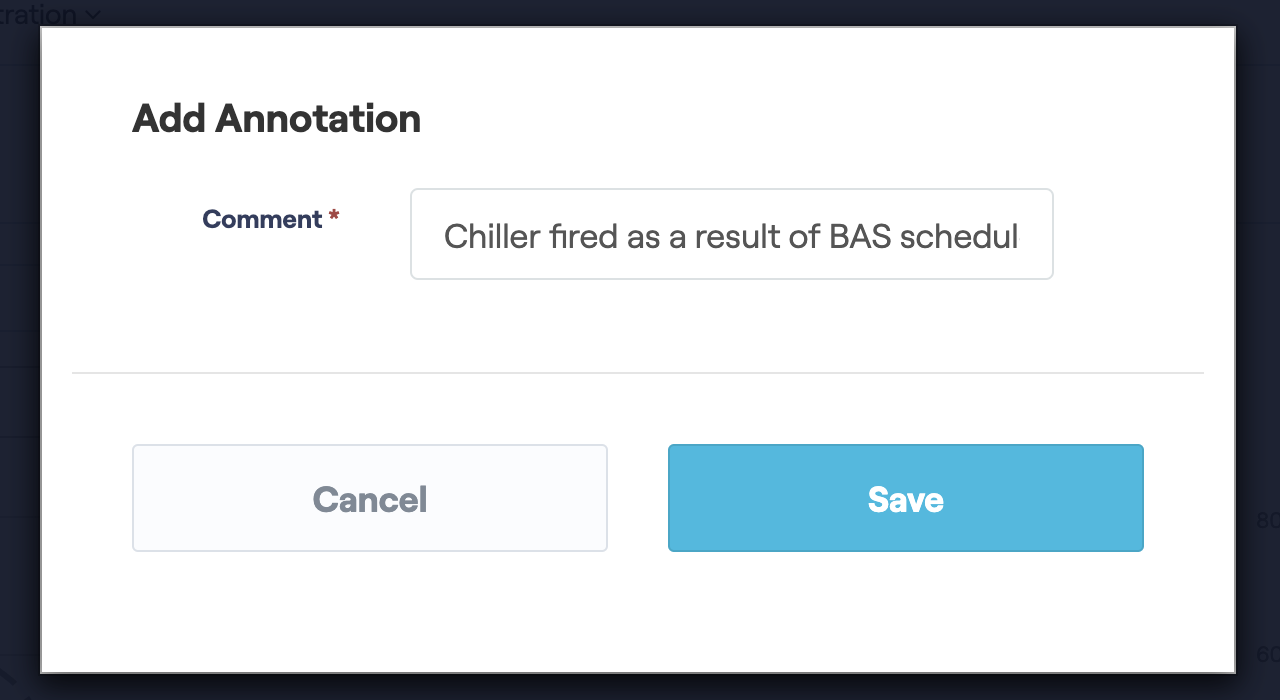
To add a new annotation, click on a specific data point. A modal box will appear to create

Highlight important information in a panel like this one. To edit this panel's color or style, select one of the options in the menu below. |
Related articles
The content by label feature displays related articles automatically, based on labels you choose. To edit options for this feature, select the placeholder below and tap the pencil icon.


